Dashboard
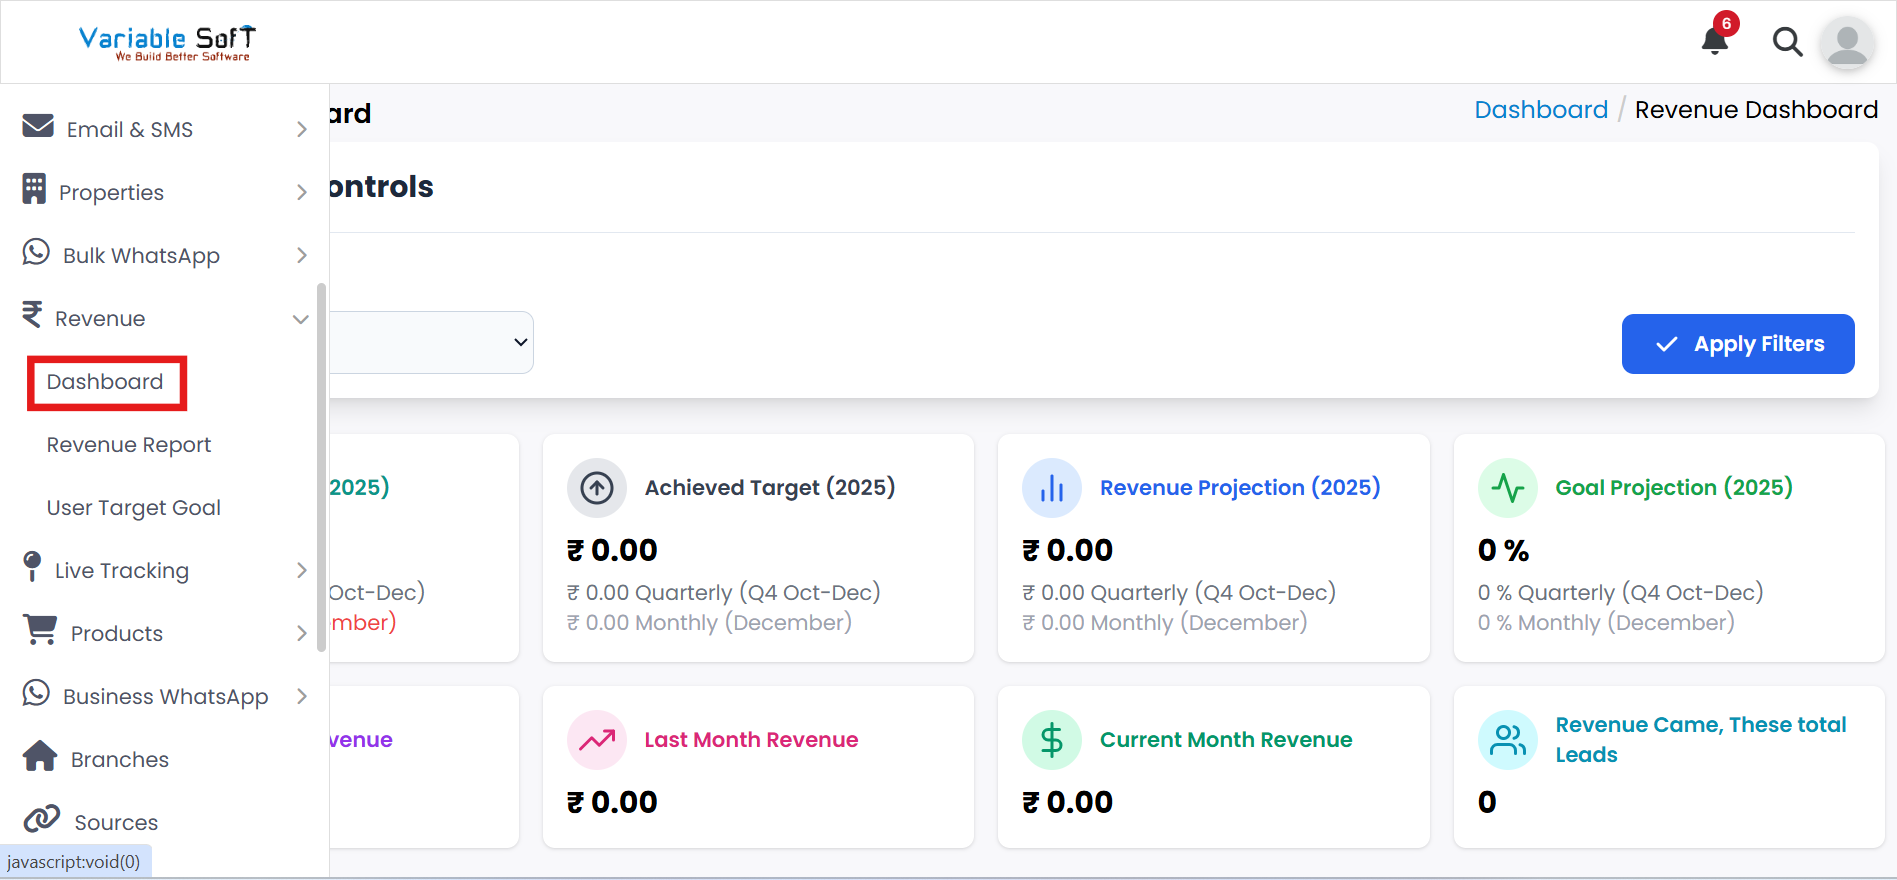
To access this feature, open your CRM Dashboard and click on Revenue. From the dropdown menu, select Dashboard to open the Revenue Dashboard page.
Dashboard Instructions
-
Step 1
Go to the Dashboard section from your CRM menu.
-
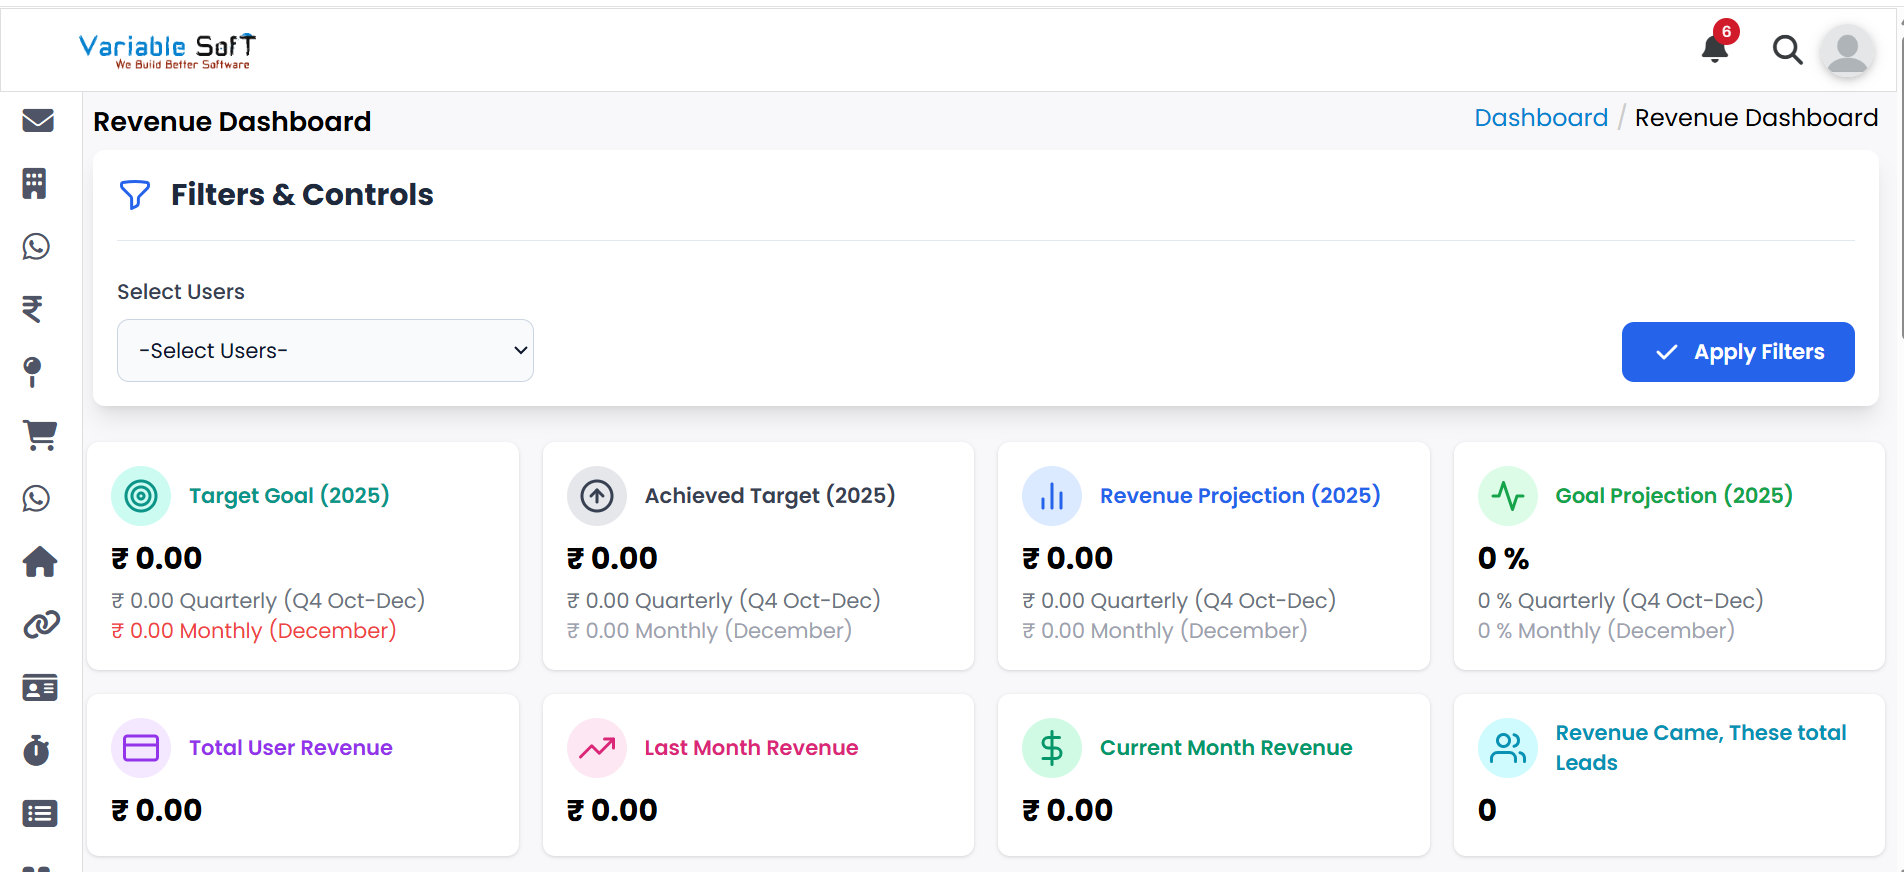
Step 2
Here you can view reports of all your revenue targets and goals.
-
Step 3
The report shows details like Target Goals, Achieved Target, Revenue Projection, and more.
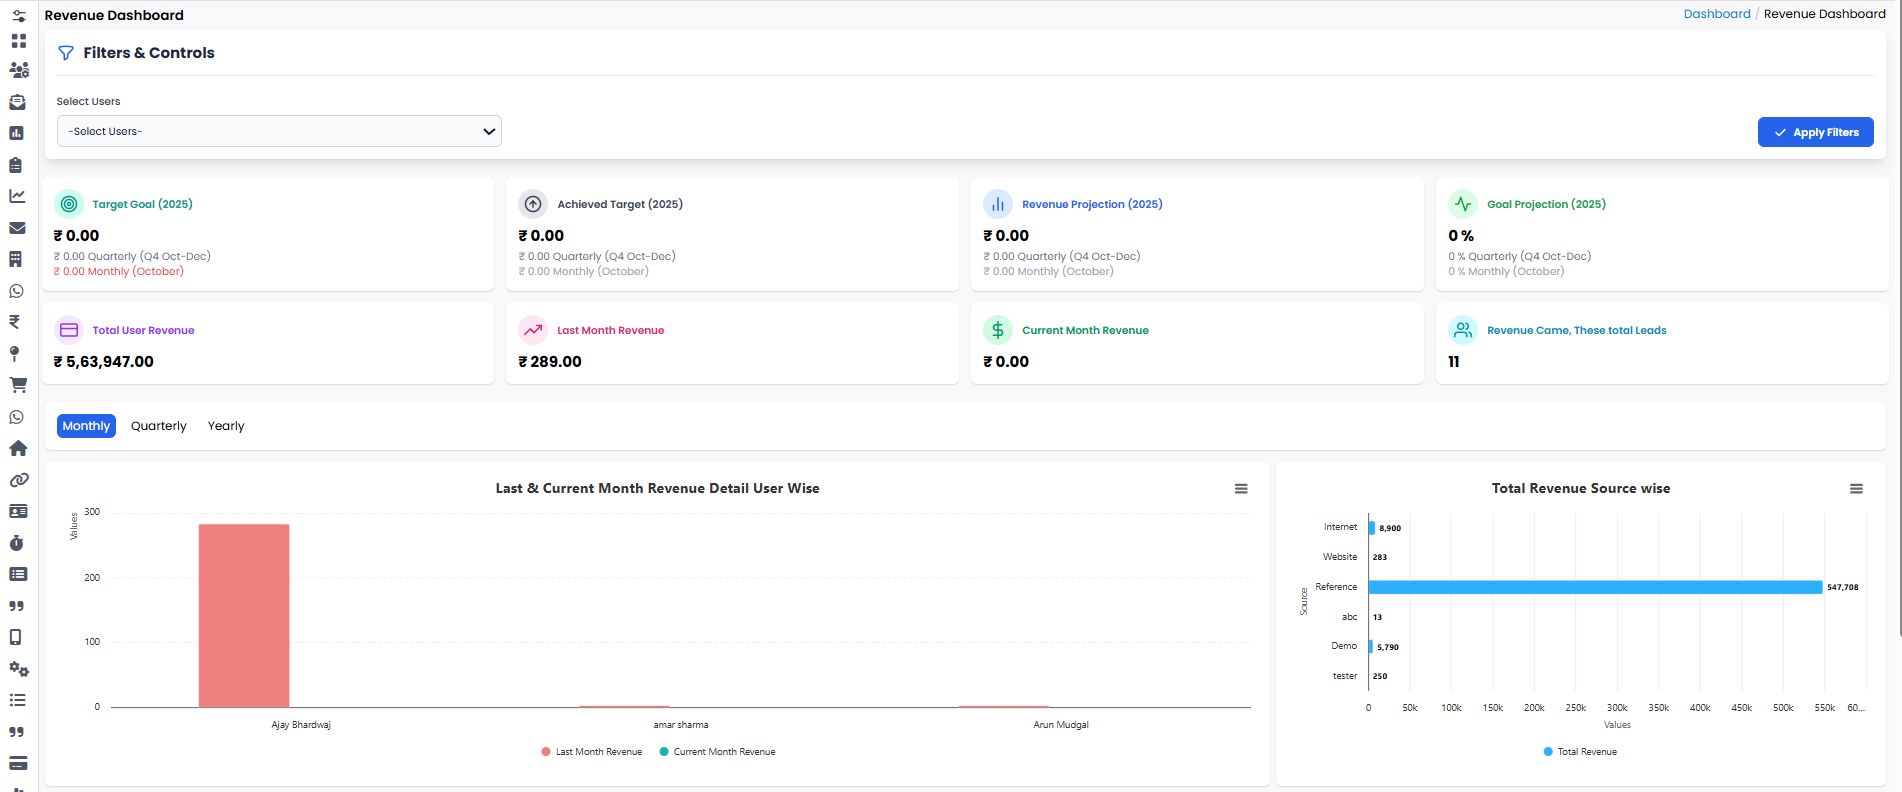
💡 Pro Tip: Monitor Your Revenue Effectively
Use the Target Goals and Revenue Projections to adjust your strategy as needed for better growth.